Power Center — insight without a data team
An analytics dashboard giving advanced insights on products, business and customers — for operators who need an answer now, not a query written for them.
- Role
- Only designer, reporting to a design manager
- Type
- B2B web app — analytics
- Scope
- User flows, dashboard structure, chart comprehension
- Part of
- Zeta's engagement suite, alongside Marketing Center and Report Center
The call I made
Optimise for comprehension over completeness. The temptation in an analytics product is to expose everything the warehouse can answer; the useful decision is which single metric earns the headline position on each view, and which comparison belongs beside it.
Keeping the filter model identical across views cost some per-view flexibility, and bought the ability to move between them without relearning the page.
I owned
- User flows and dashboard structure
- Chart and comparison choices
I partnered on
- Metric definitions with product
- Direction with my design manager
Where the judgment was
- Comprehension over completeness
- A consistent filter model across every view
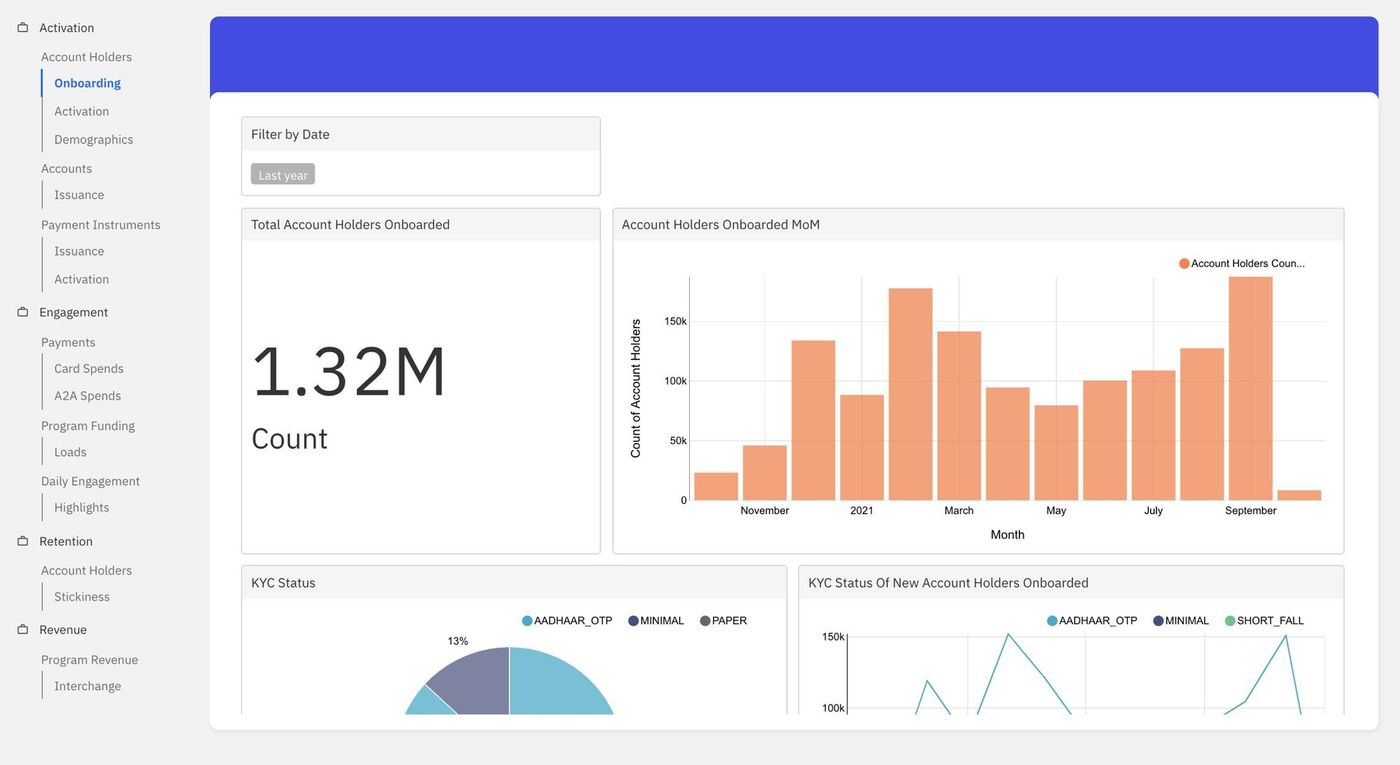
About
Power Center is an analytics dashboard that provides advanced insights on products, businesses and customers. It shows trends across key metrics that can be used to make appropriate and timely business decisions, and lets the user slice data across multiple dimensions — offered as filter criteria such as date range and product type — with intelligent visualisation techniques to make gathering insight easier.
I was the only designer, reporting to a design manager. I created the designs that laid some of the foundation for the Power Center user flows, and made sure the team could easily grasp the complex technical concepts and the graphs that expressed them. In a product like this, the design problem and the comprehension problem are the same problem.
The dashboard
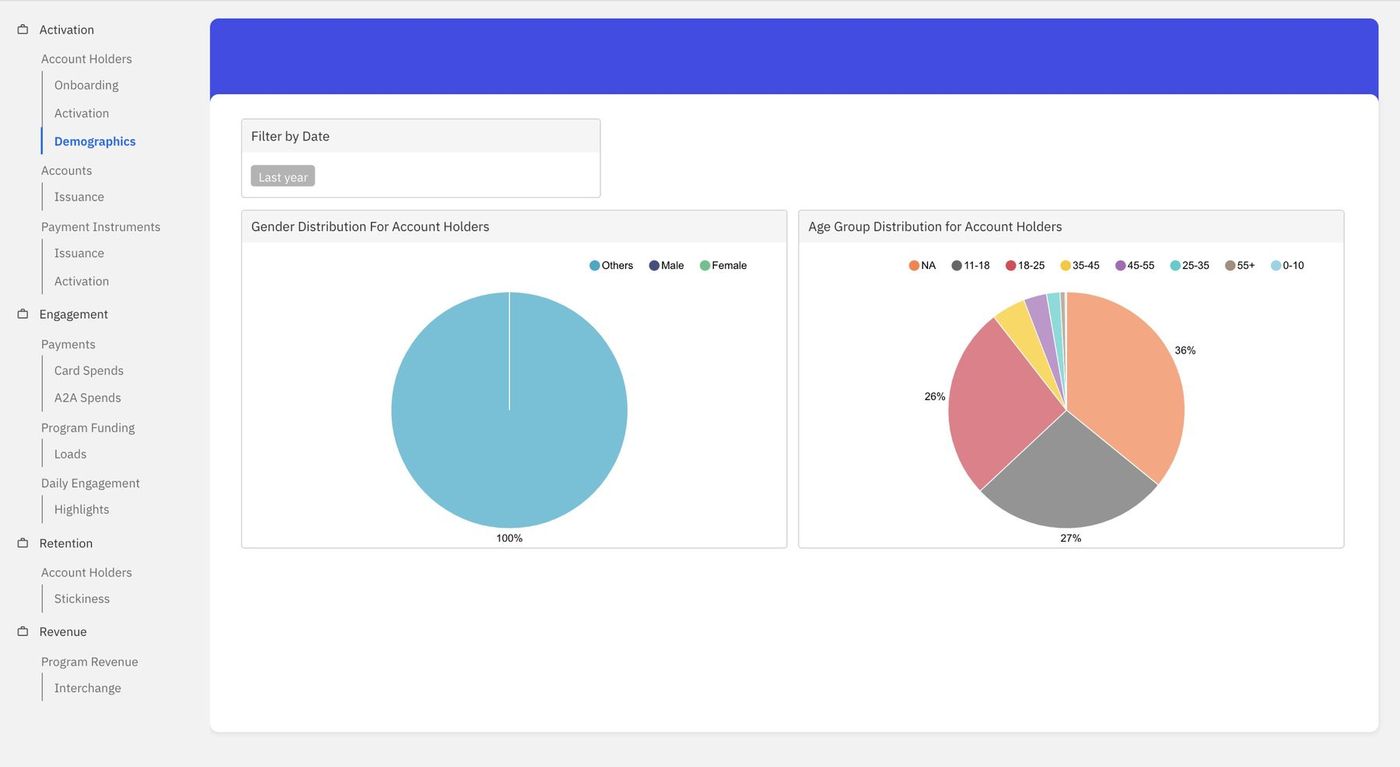
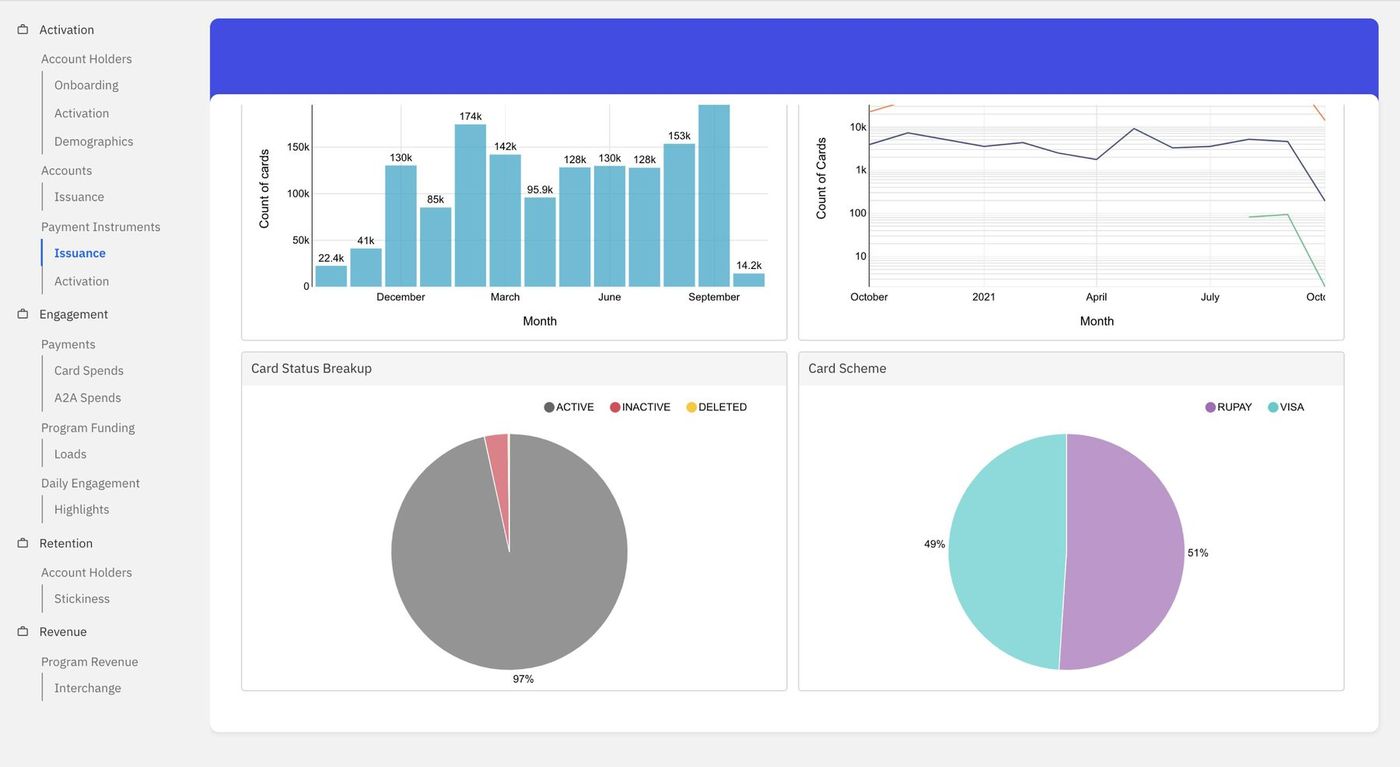
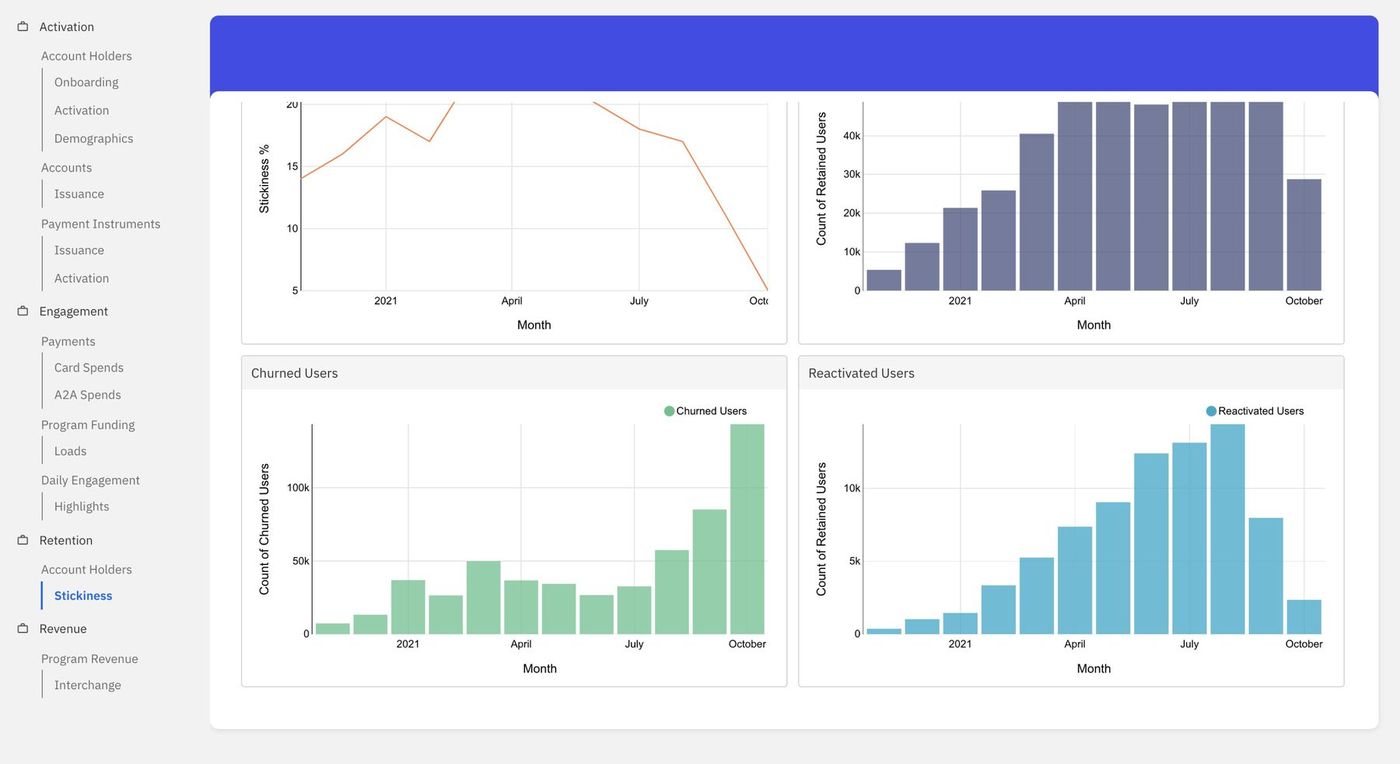
Activation, engagement, retention and revenue, each with its own read.
What it took
A dashboard is scanned, not read. The work was in deciding which metric earns the headline position on each view, which comparison belongs beside it, and how to make a distribution legible to someone who is not a data analyst — while keeping the filter model consistent enough that moving between views doesn't mean relearning the page.